If we can understand the structure of food, we can modify and control it to include more sustainable ingredients. The structure within a food product underpins the consumer’s overall sensory experience. However, the complexity of the multiphase architecture in food makes it difficult to study the structural details and characterize the interactions between components or how they change during processing.
This challenge becomes even more pronounced as our search for more sustainable foods necessitates the use of new ingredients, which are less understood and often not refined. It is essential to ensure that these new ingredients form the appropriate structure in food to meet consumers’ expectations.
In practice, achieving this goal is not easy, as structural heterogeneities or multiphase structural arrangements cause unique functional properties. Researchers need new methods to characterize physical and chemical differences in food structures. They could benefit from an analytical technique that lets them zoom-in on the details and discover the composition of a food matrix.
Confocal Raman microscopy is a promising, emerging technique for studying complex multiphase food samples with a growing number of reports on applications in soft materials. The instrument has potential to help improve our understanding of how ingredients in foods interact and form structures.
CONFOCAL RAMAN MICROSCOPY
Vibrational spectroscopic techniques, such as Raman, provide information about chemical structures and molecular interactions. In confocal Raman microscopy, researchers also collect information on phase distribution, because spectra are obtained by focusing a laser beam to a controlled penetration depth for a known area within a sample. Hence, information about different classes of molecules is combined with their location in situ, under realistic conditions, without the need for sample modification or labelling.
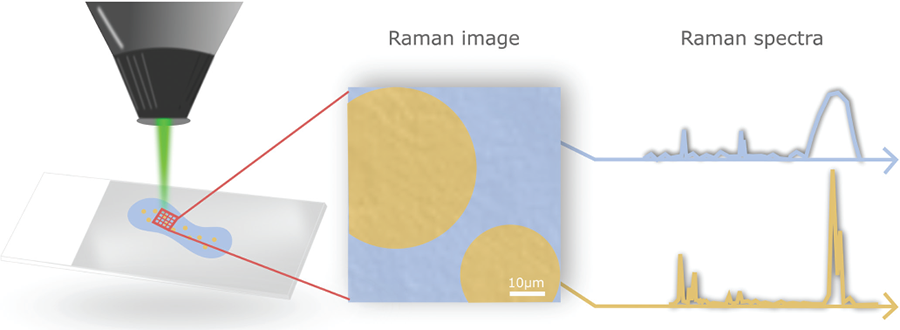
A Raman spectrometer integrated with an optical microscope allows a researcher to first survey a sample using bright-field microscopy to define where to collect spectra. In bright-field microscopy, light is transmitted through the sample generating an image with high contrast where light has been absorbed by dense areas of the specimen. Researchers then collect Raman spectra from specific points within the structure to determine the difference between phases (Fig. 1).
The proteins and peptides in food contain amide bonds that produce Raman signals at specific frequencies. These frequencies shift depending on the relative position of protein side chains and their interaction with other functional groups. In addition, the OH stretch mode frequency is a sensitive indicator of the different structural environments influencing the local hydrogen bond structure of water.
By integrating the peaks in Raman spectra collected across a defined sample area, the instrument provides a map of the distribution of chemical bonds pertaining to fat, protein, and other food ingredients in an image. This is a useful way to identify the microstructure of a food sample. A one-dimensional (line) scan provides fast information about structural changes across a sample. Samples are typically analyzed in 2-dimensional (or even 3-dimensional) areas of interest.
While other microscopic methods, such as confocal scanning microscopy and related techniques, offer a high-resolution structural overview, the chemical mapping obtained by confocal Raman microscopy provides novel insights without the use of specific fluorescent probes or sample modification. However, confocal Raman microscopy is not a replacement for current methods. This supplemental tool unlocks information about complex structures that cannot be observed otherwise.
STUDYING DAIRY FOOD SYSTEMS
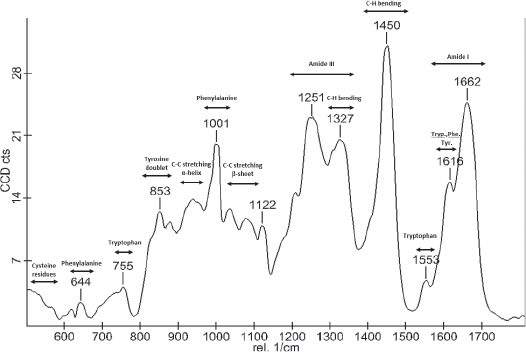
A team at Fonterra Research and Development Center in New Zealand recently used Raman imaging to distinguish between different protein structures within a casein matrix, identifying which were whey particles (https://doi.org/10.1255/jsi.2020.a9). The team first analyzed a control sample of the whey particles to establish a spectral and microstructural reference (Fig. 2&3). Then they imaged two different sample types: a standard cheese control sample and the same cheese with whey protein particles added.
The group used different chemometric techniques to compare the spectral data from each image pixel. When three different peak maps were overlayed into one image, it showed good differentiation between the three chemically distinct components: fat, whey protein and casein protein. Contrast between the two proteins is possible because of the way the Raman signal for amides varies in whey versus casein protein.
The application of spectral methods to investigate the chemical structure within dairy food systems is useful for analyzing the effect of processing and composition on individual food components. In addition, Raman spectroscopy imaging techniques identify and locate various structures within a food sample at a microscale with the potential to reveal structure–function relationships.
FOLLOWING HYDRATION OF PROTEIN STRUCTURES
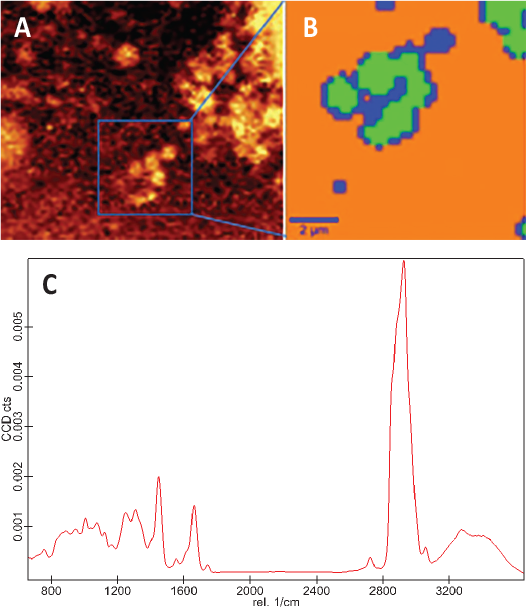
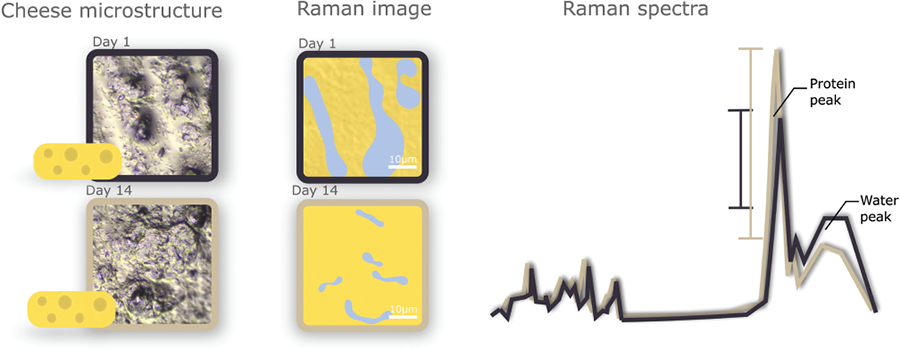
An other example of how confocal Raman microscopy provides important physical and chemical information is its ability to identify water and, therefore, hydration levels within complex protein structures. Although water content—as well as water molecular mobility—is measurable with other techniques, like Nuclear Magnetic Resonance (NMR) spectroscopy, confocal Raman imaging shows the spatial distribution of water.
This information leads to understanding potential water displacement or competitive hydration between food macromolecules, important for food products containing protein and starch. Water behavior is a key parameter affecting texture, juiciness, and storage stability. Raman microscopy is ideal for this type of analysis since water has a distinct Raman signal that makes it easy to assess hydration (Fig. 4).
The analysis method has so far proven useful for studying protein-rich networks, such as pizza cheese or meat analogues (https://doi.org/10.1039/D3SM00170A). Here, we have demonstrated that collecting a scan for each pixel within a defined area and calculating the average of all the spectra corresponding to a protein signal is a robust approach for assessing the hydration of the protein phase across samples. This approach can also be applied to visualize other types of heterogeneous food domains.
DETERMINING CRYSTALLIZATION OF FAT IN EMULSIONS
Confocal Raman microscopy can also provide novel, complementary information in food structure characterization to give researchers an understanding of fat crystallization, especially within multiphase systems, such as emulsions.
When liquid oil is cooled below its melting point it forms crystals, which then connect into a network. The properties of this network impact the overall properties of the final products. Hence, fat plays an important role in the structure, texture, taste, and shelf-life of many food products.
This phenomenon has been extensively studied in bulk fat systems, but determining the local distribution of fat crystals in complex food matrixes is a challenge. In food, fat is often present in an emulsified phase that is dispersed into another phase. It is important to understand the properties of fat in such systems, how it is organized locally within the system, and how other components impact its bulk properties.
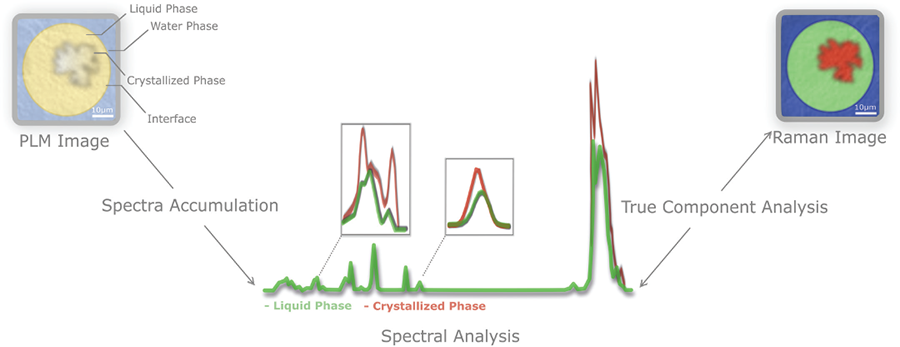
Here, confocal Raman microscopy provides a tool to evaluate the crystallization within complex systems as illustrated in Fig. 5. Crystallized fat and liquid oil show district differences in Raman spectra, making it possible to distinguish these components in a Raman image.
One potential application includes, identifying where crystals are located within oil droplets. Another might be, studying how changes at the interface between the water and the oil impact not only the final distribution but also the crystallization process. Based on the Raman spectra it is also be possible to obtain indications of crystal polymorphism, as shown in studies on pure model systems (https://doi.org/10.1016/j.foodchem.2015.09.043).
ANALYSIS CHOICES IMPACT REALITY
As exciting as the potential for using Raman microscopy to study foods may be, it is important that researchers know they will need to evaluate analysis modes and data handling critically. Different sample collection procedures, as well as data treatment approaches are available to obtain Raman images, and the choice of methods will impact the final image.
Method optimization is necessary for each system to ensure proper component identification, as well as the generation of meaningful images. At the Department of Food Science at Aarhus University, we are developing methods to study different food systems with confocal Raman microscopy.
In the hydration study above, we compared different means of processing spectroscopic data. Our findings highlight how critical data handling and processing is, and how this impacted the Raman images we obtained. Anyone considering applying this microscopy technique for the analysis of food systems must take these factors into account.
Univariate data collection applies filters on some of the vibrational signals which can be helpful when investigating complex matrices with peaks in overlapping regions. However, the analysis requires prior knowledge of the sample composition to select the specific vibrational bands that will be used to create an image. Selecting the wrong bands to analyze could mean trying to acquire an image from a band with low signal, causing poor resolution.
On the other hand, multivariate analysis uses the full Raman spectra, considering all available chemical information, but also requires careful interpretation to ensure meaningful results. This approach can either include reference spectra of known origin or unsupervised component identification. We found that a combined approach of both methods gave the truest results.
In addition, images obtained by confocal Raman microscopy show the spatial distribution of a certain number of identified components. The image results from the analysis of collected spectra and is subject to the resolution of the spectral baseline. Data processing is necessary for spectroscopic data to ensure baseline corrections, reduce noise, normalize the data for quantitative information, and separate overlapping peaks. All these steps will impact the image outcome. Inappropriate data processing leads to oversimplification and masking components with weaker Raman signals.
The spatial resolution of the chemical mapping is sufficient to trace the location of specific components in a sample, identify chemical changes, or monitor physical or structural changes. There are limitations to confocal Raman microscopy’s spatial resolution, however.
Spatial resolution is vital for discriminating different structures in a sample. The better the spatial resolution, the more detailed the sample information. Since the spatial resolution is proportional to laser excitation wavelength, shorter wavelength lasers can be used to achieve higher spatial resolution. Raman microscopes are commonly equipped with multiple laser wavelengths allowing the user to find the best compromise between required spatial resolution and other constraints. Currently, it is possible to reach a submicron resolution of about 250-300 nm.
Raman images can be created with the toolboxes available, but these images might reflect very different aspects of a sample or even artefacts such as differences in focal point. For best results, it is necessary to have prior knowledge of the sample composition, and the specific Raman signals of interest, either from existing research, literature, or reference samples. This becomes especially crucial in complex systems with multiple phases where overlapping peaks often occur. This is why confocal Raman imaging and traditional microscopy complement each other.
About the Author
This article is based on work within the platform for vibrational spectroscopic imaging at Aarhus University, Department of Food Science. (sbg@food.au.dk) is leading the work within the platform led by professor (mc@food.au.dk) together with PhD students (jfd@food.au.dk) and (dneofytos@food.au.dk) who have carried out the research data on protein structures and fat crystallization, respectively. This is a collaboration with Arla Food Amba and funded by the Villum Foundation, Denmark, and the CiFOOD centre of Innovation food research.